Voting History
First time visitor? Read the comic intro first!
Update for 15-Oct
In the last couple of weeks, the VBM requests have slowed down to the point where you can see a slight curve bending down.
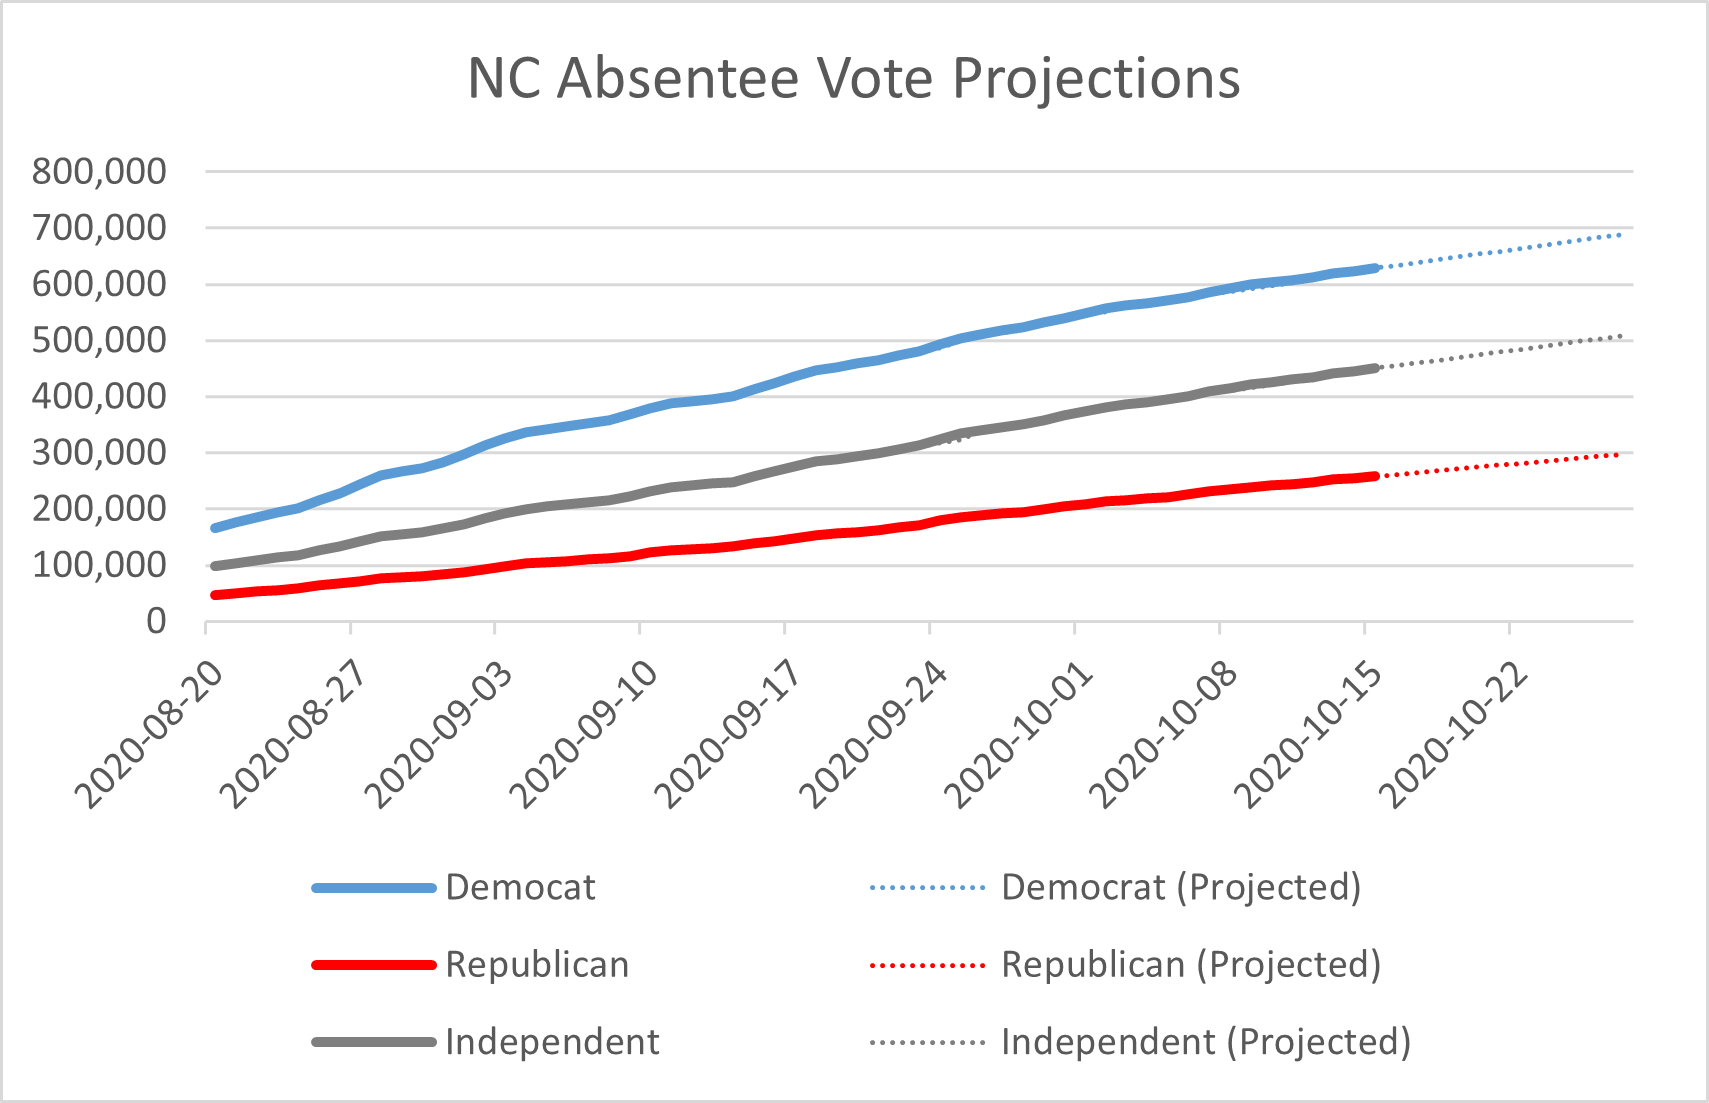
In the above image, the actual numbers are the solid lines, the projections are dashed lines. Since the last update, the trend has slowed down somewhat especially for Democrats.
| 2020 NC VBM target to match 2016 | Original Projection | 5 Oct Update | 15 Oct Update | Gap | |
|---|---|---|---|---|---|
| Democrats | 936,296 | 761,992 | 717,971 | 688,944 | -247,352 (Severely underperform) |
| Republicans | 282,911 | 288,630 | 305,380 | 297,737 | +9,107 (Slight outperform) |
| Independents | 430,758 | 513,106 | 531,316 | 509,018 | +78,260 (Well Outperform) |
This equates to 36.79% of 2016 turnout for Democrats, which is well below the 50%+ claiming to vote by mail per pollsters. Where are the “missing” Democrats? That remains to be seen.
Today, in-person early voting starts for North Carolina. It will take a week or so to establish trends, but in-person voting will provide the first acid test for Joe is Done.
To match what polls claim, roughly 20% of each party in terms of 2016 turnout should be turning out for in-person early voting.
For the Joe is Done hypothesis, this means in-person voting should be roughly equal by registration for all parties. Obviously, higher D turnout will be more favorable to Biden, whereas higher R turnout will be more favorable to Trump. I will give in-person voting a week or so to shake out and do my second phase analysis then.
Moving on to voter history registration - these charts take me a long time to compile, so I will post without much commentary.
First time voters
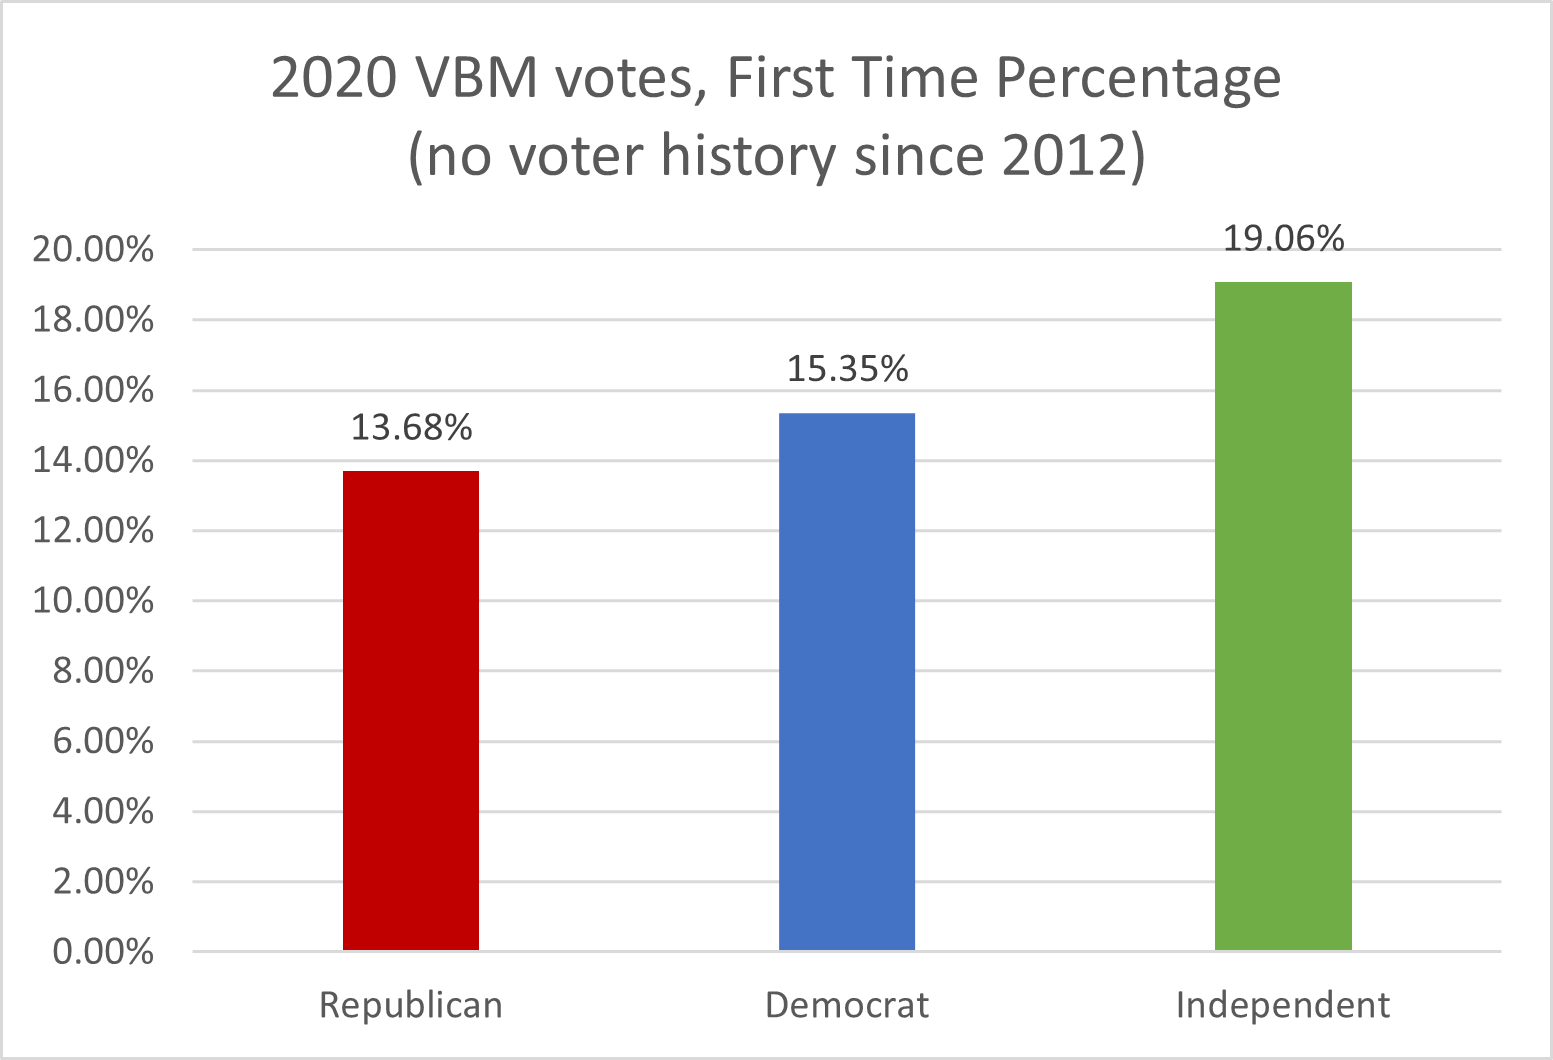
We start with what I see as bad news for Trump. Republicans have a slightly smaller percentage of first-time voters compared to Democrats and Independents. However, the advantage is small, and this may be an artifact of Simpson’s Paradox since Republicans are particularly older for VBM.
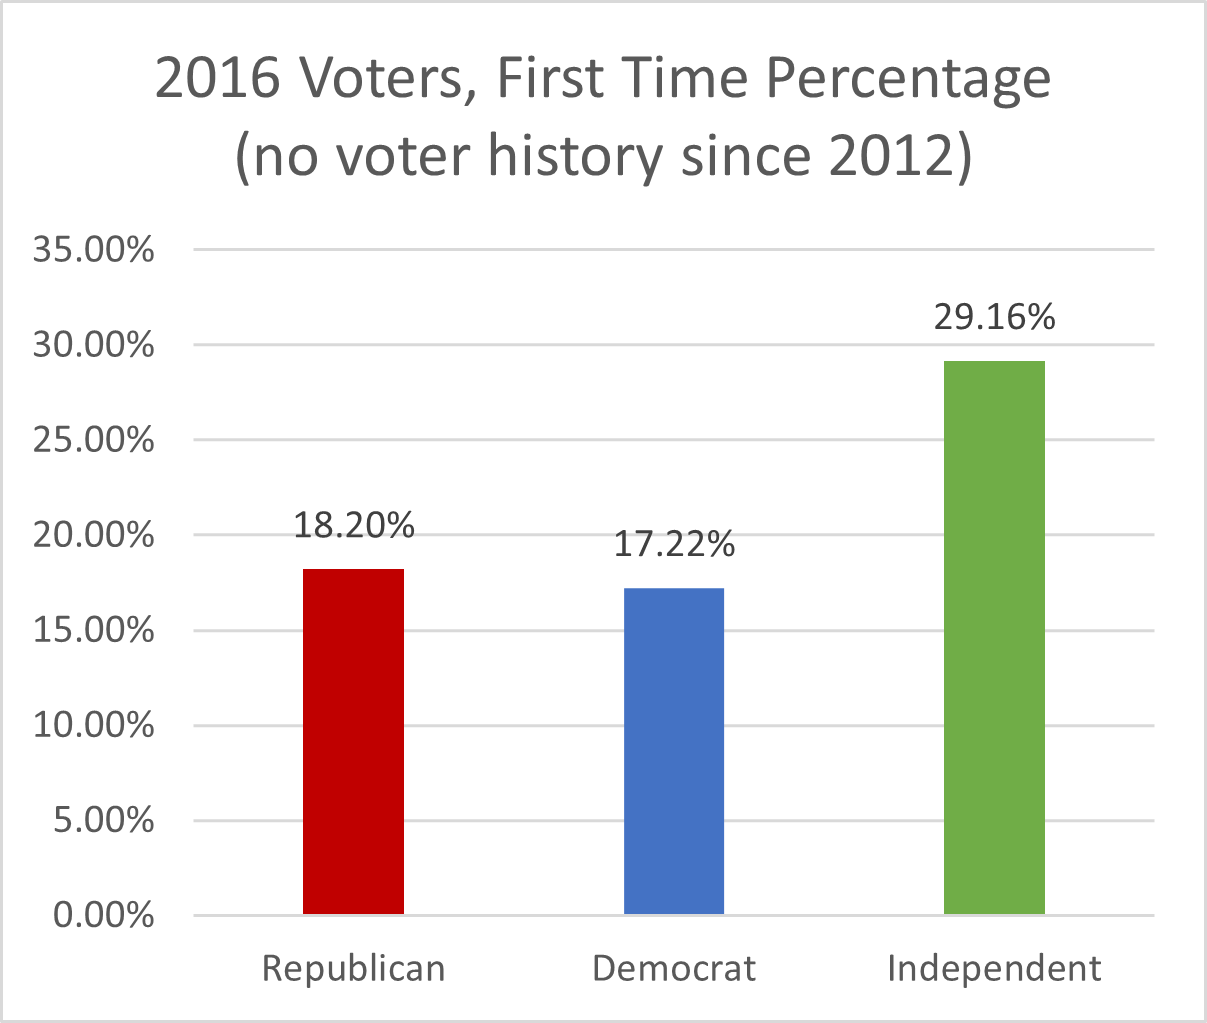
By comparison, in 2016, Republicans had a higher percentage of first-time voters. But this may change as in-person voting happens.
Of note is that first-time voters make a somewhat smaller percentage overall in 2020 compared to 2016.
Next I show the crosstabs by party, age, and gender:
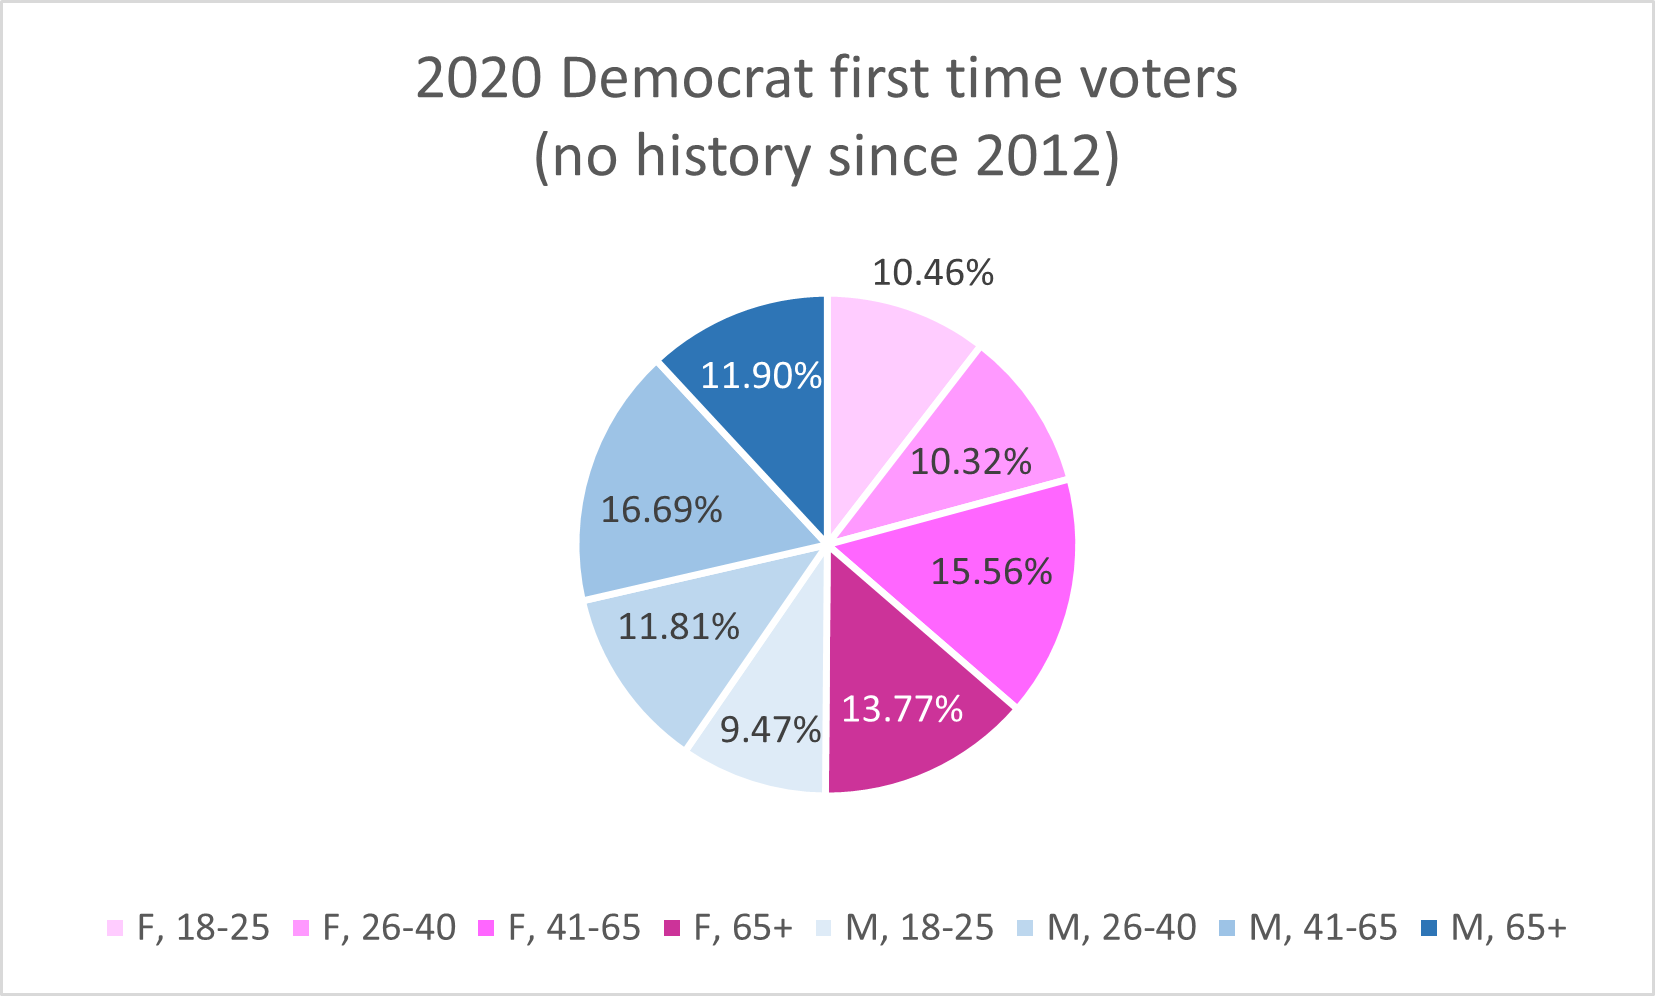
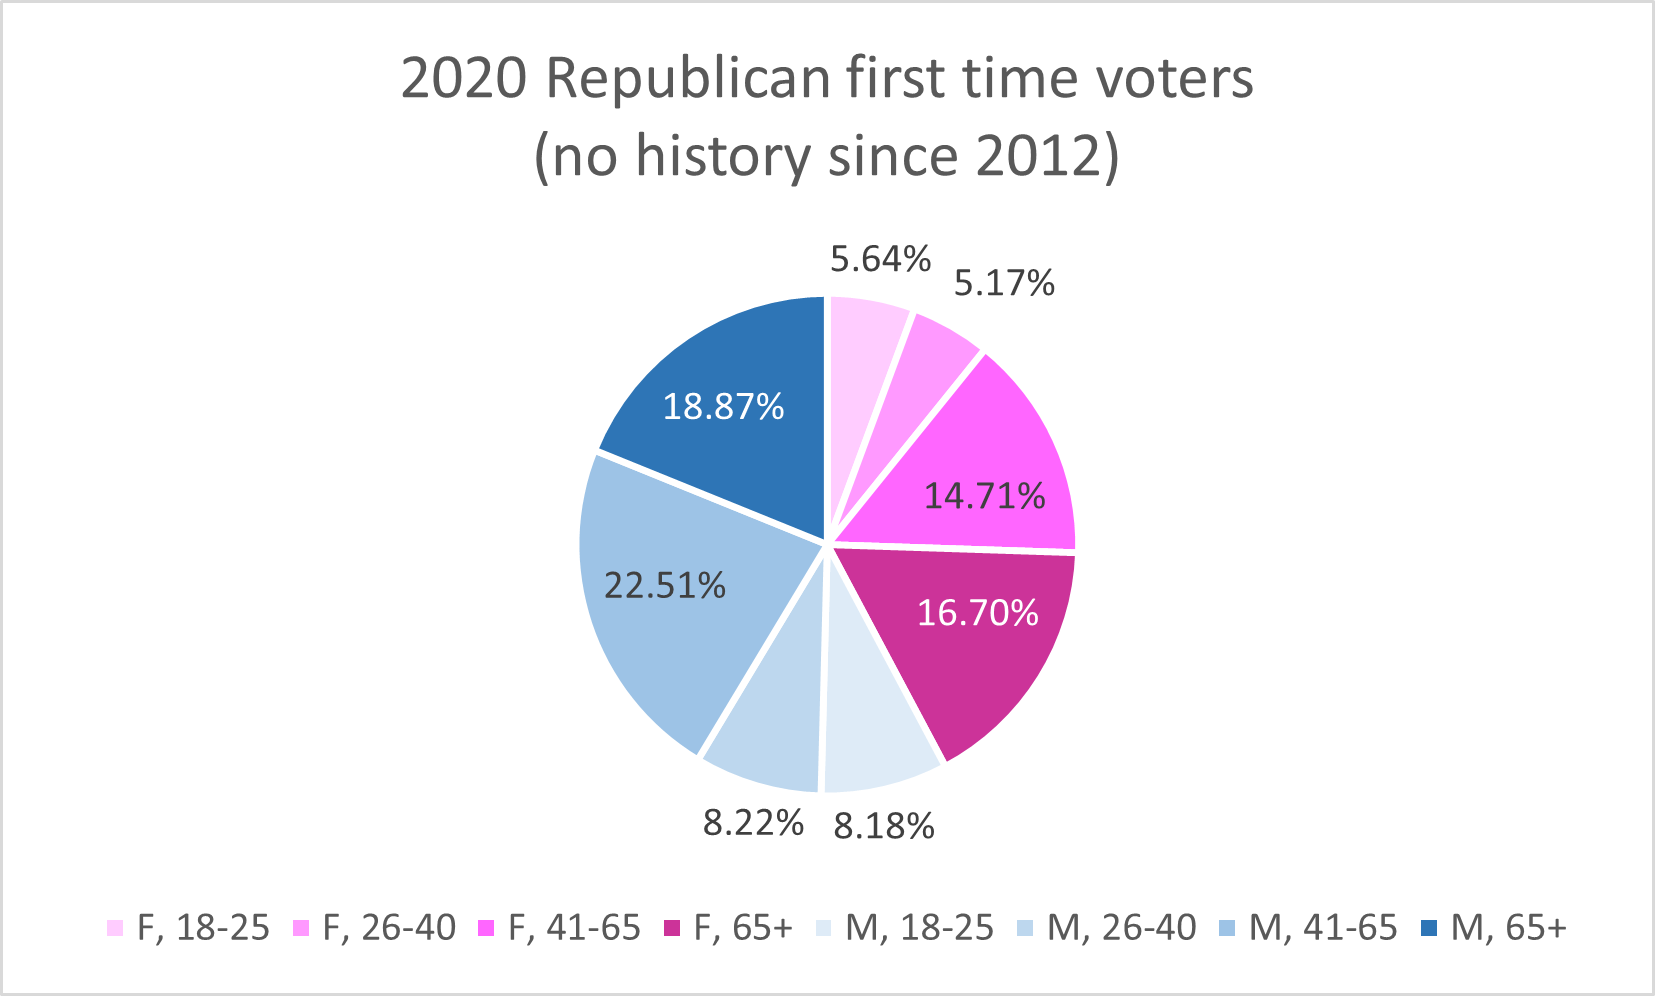
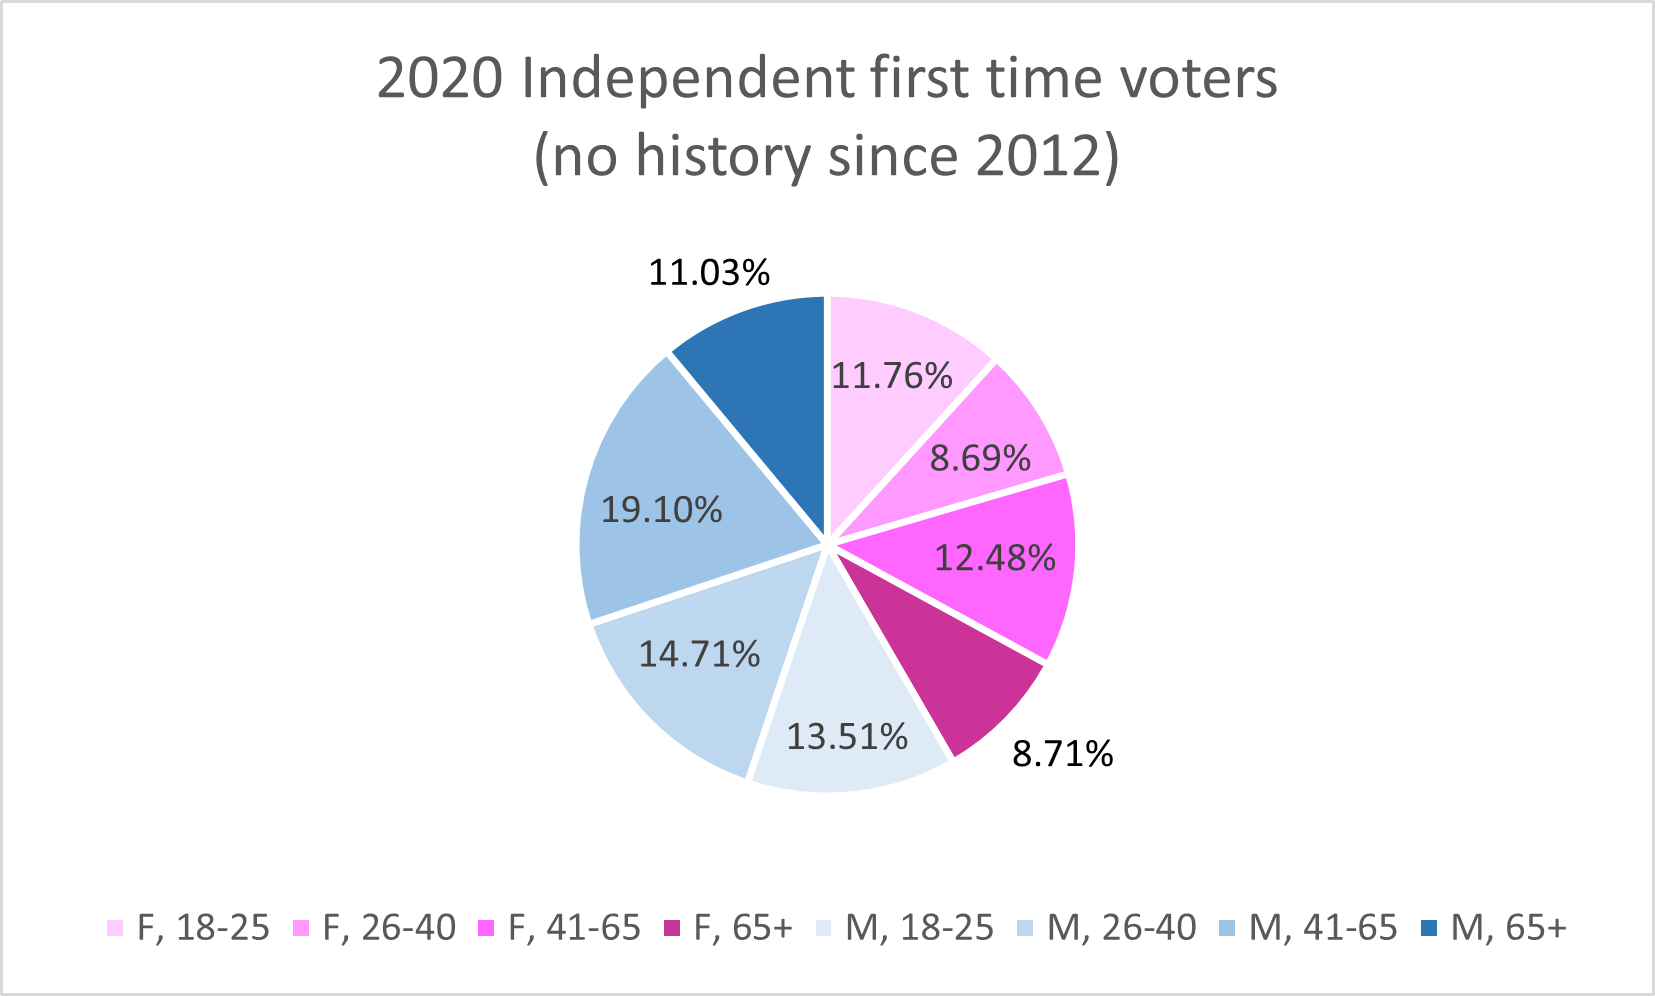
If you compare to the post from last time, you note a pattern: first time voters are more likely to be male compared to the rest of voters. This confirms Richard Baris’ polling that males are unusually motivated this year.
Supervoters
Supervoters are defined as people who voted in three general elections previous to this one.
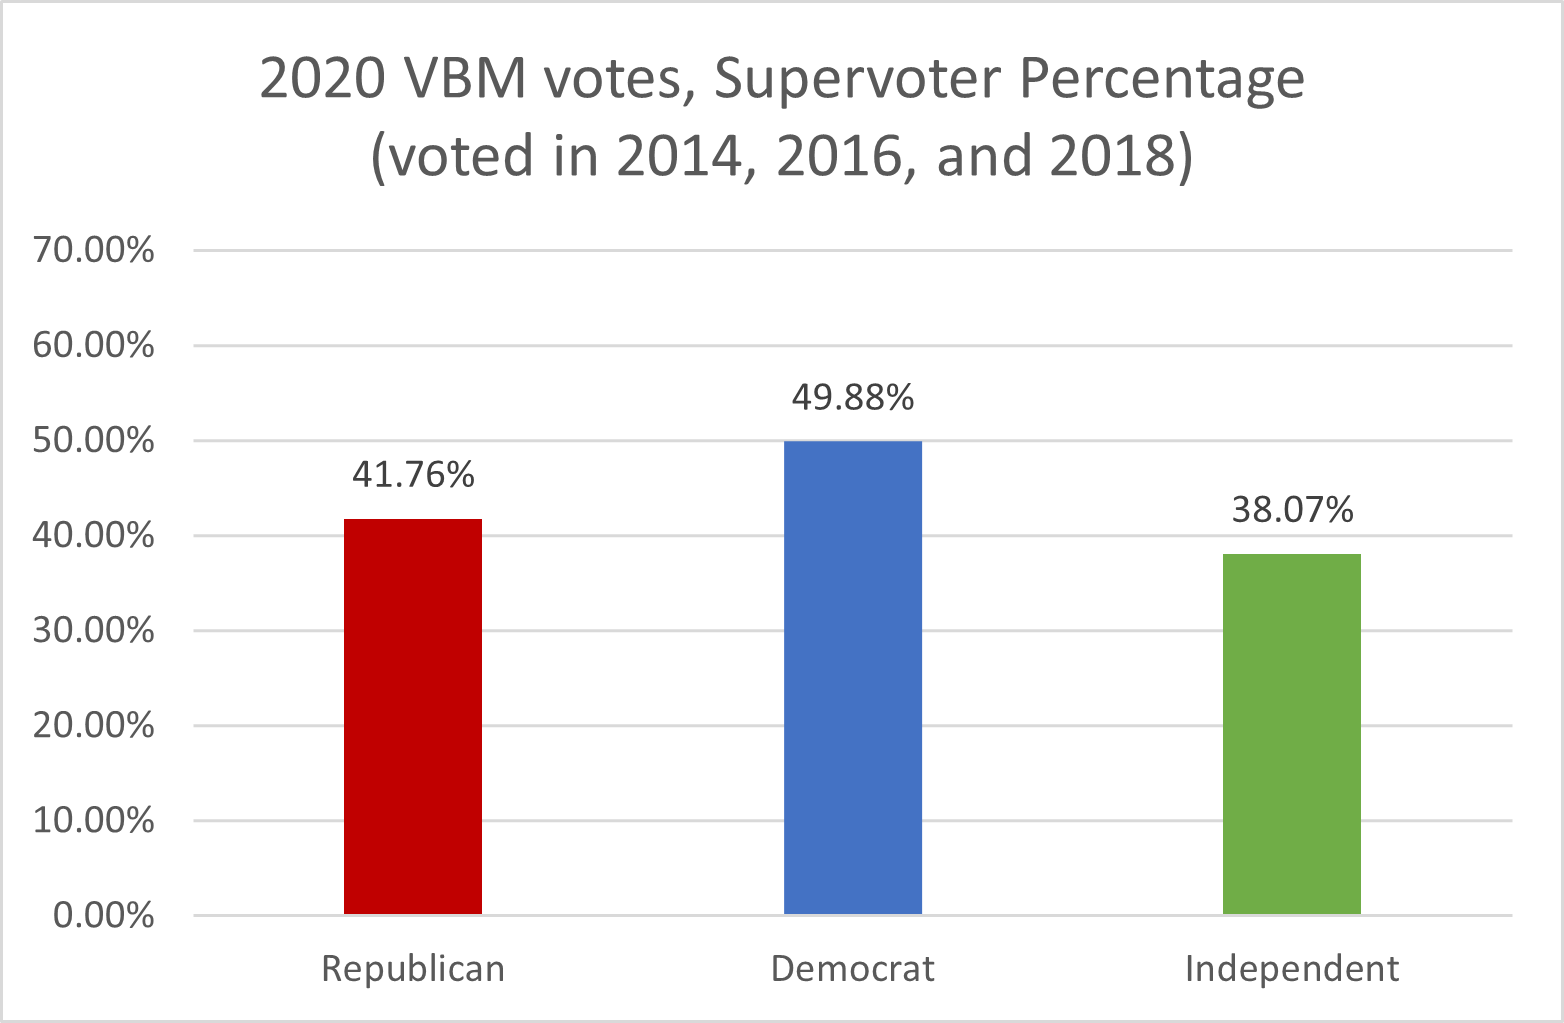
Here, we find that Democrats are about half supervoters, with a much lower Republican ratio. The lower Independent supervoter percentage is most likely due to new North Carolina residents tending to register as independents.
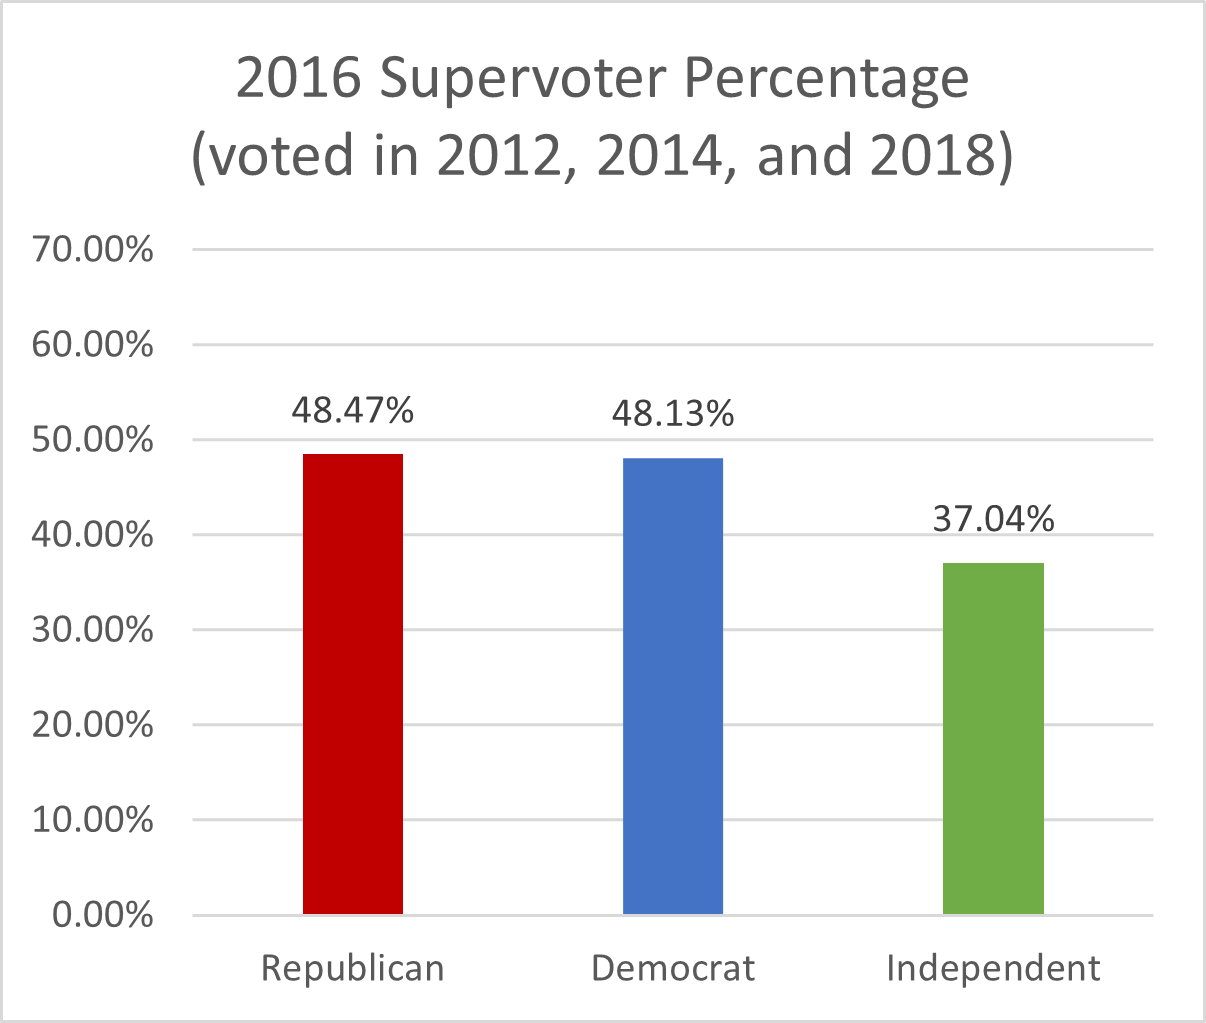
By comparison, in 2016, Republicans and Democrats had about equal supervoter turnout.
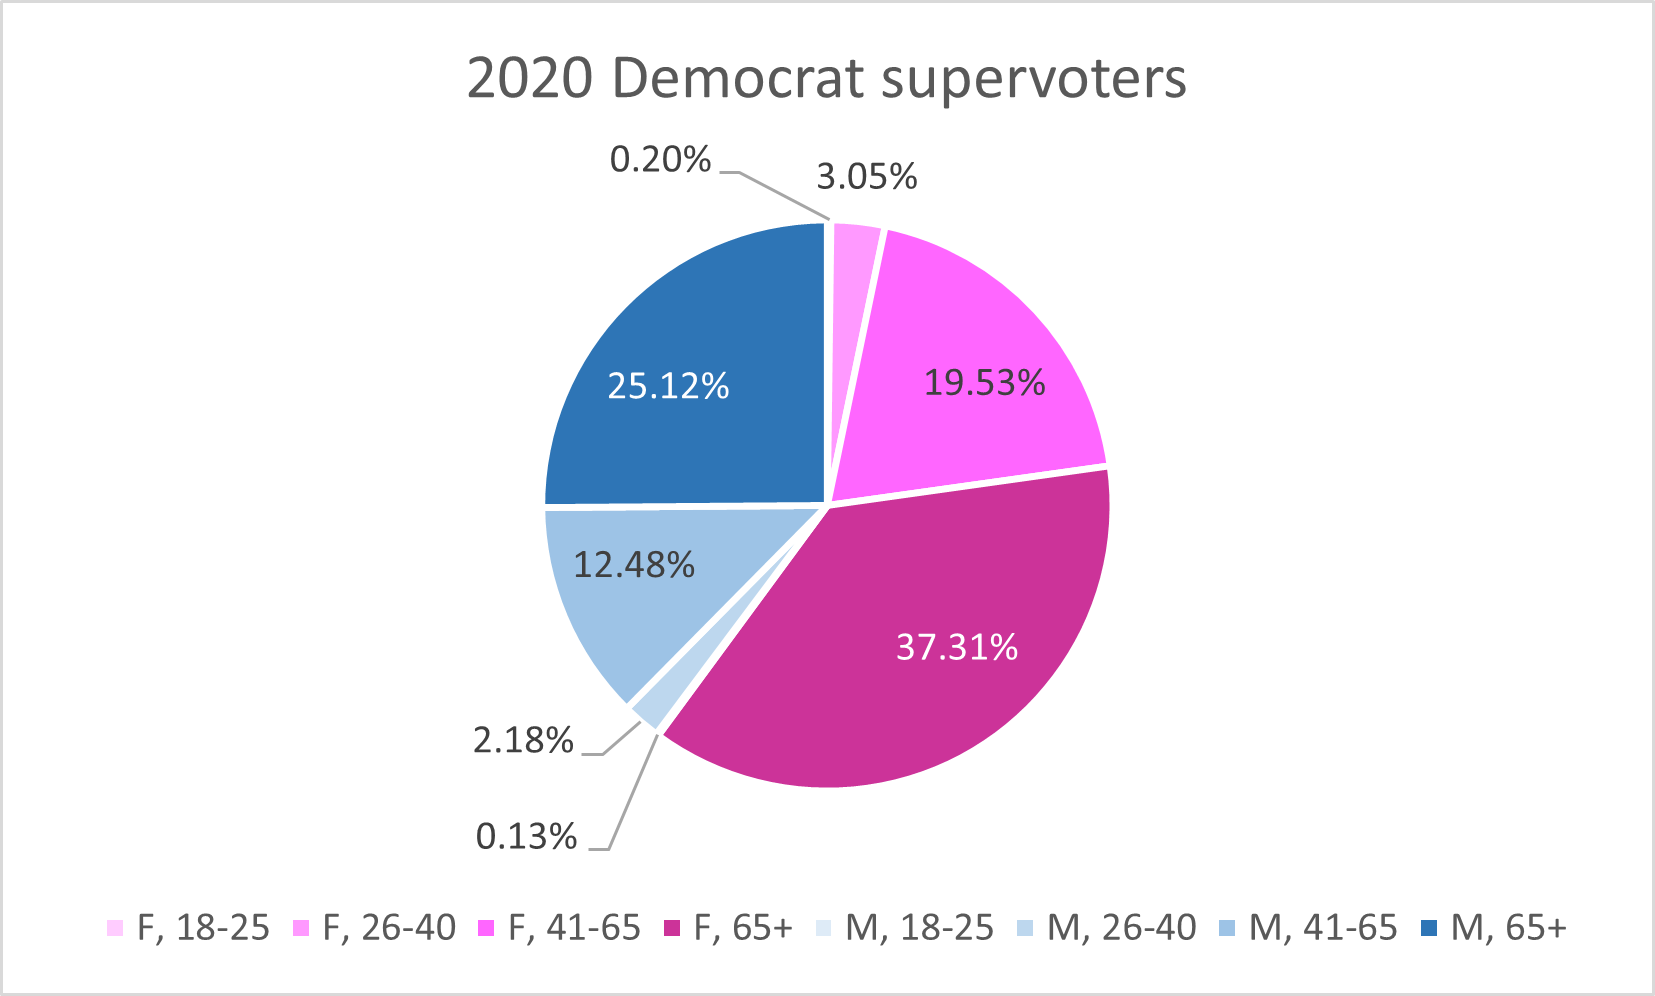
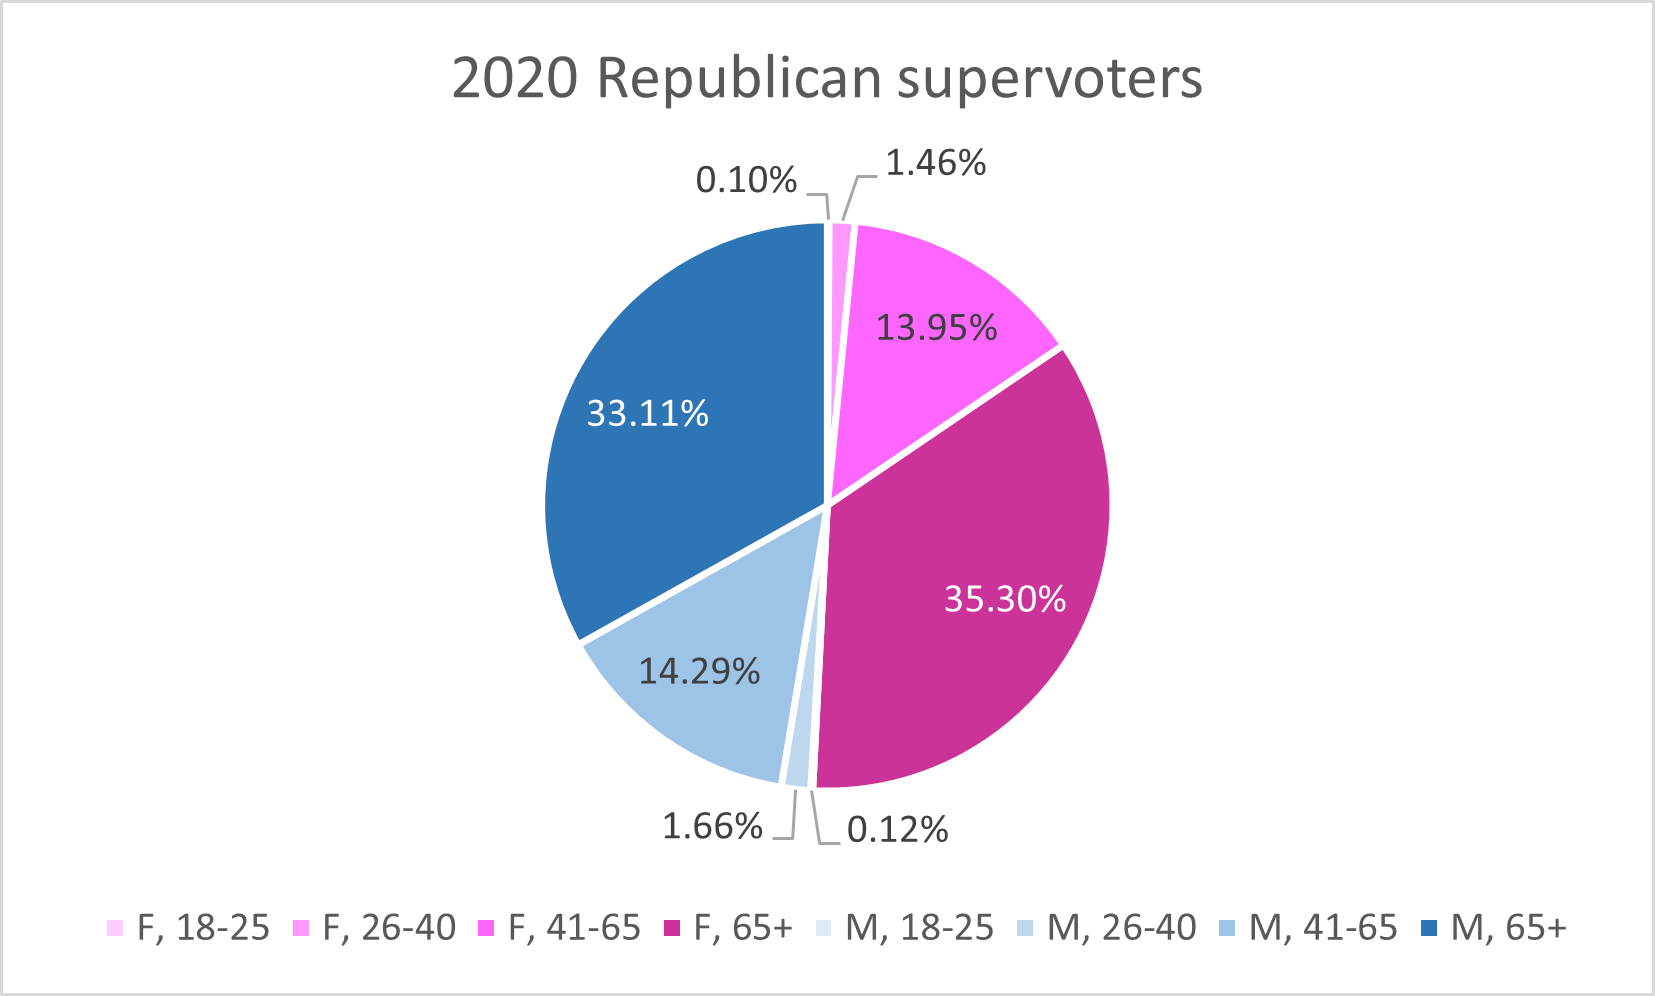
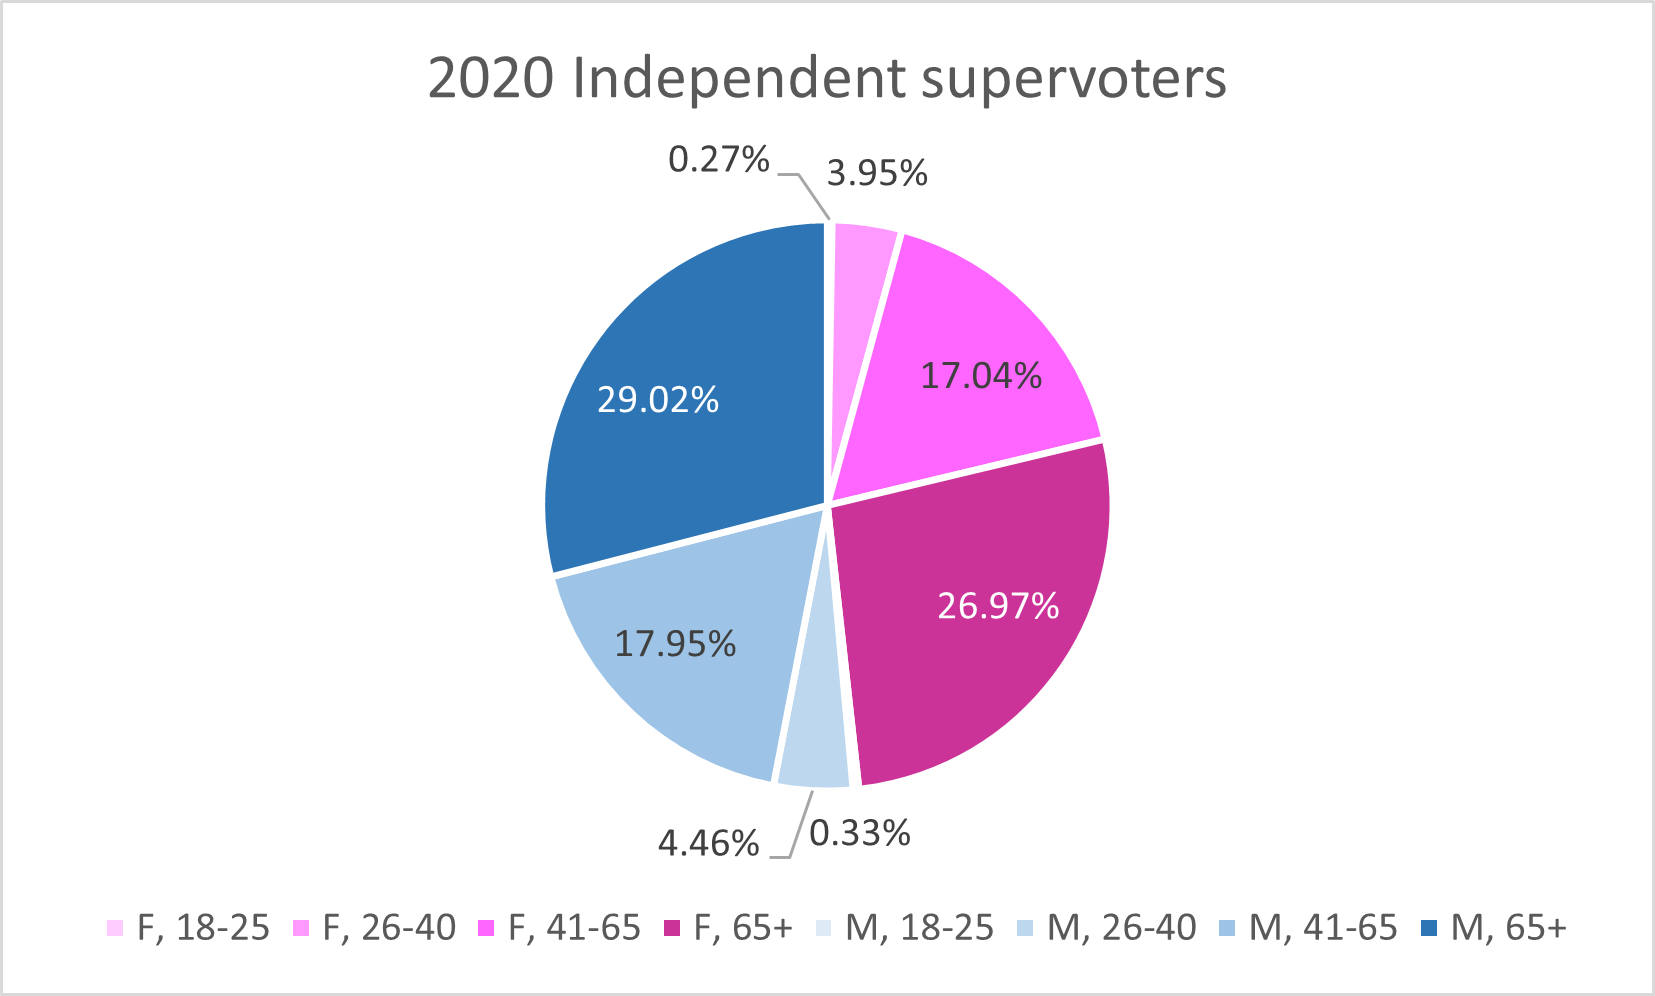
Supervoters tend to be older and more female.
2016 Voters
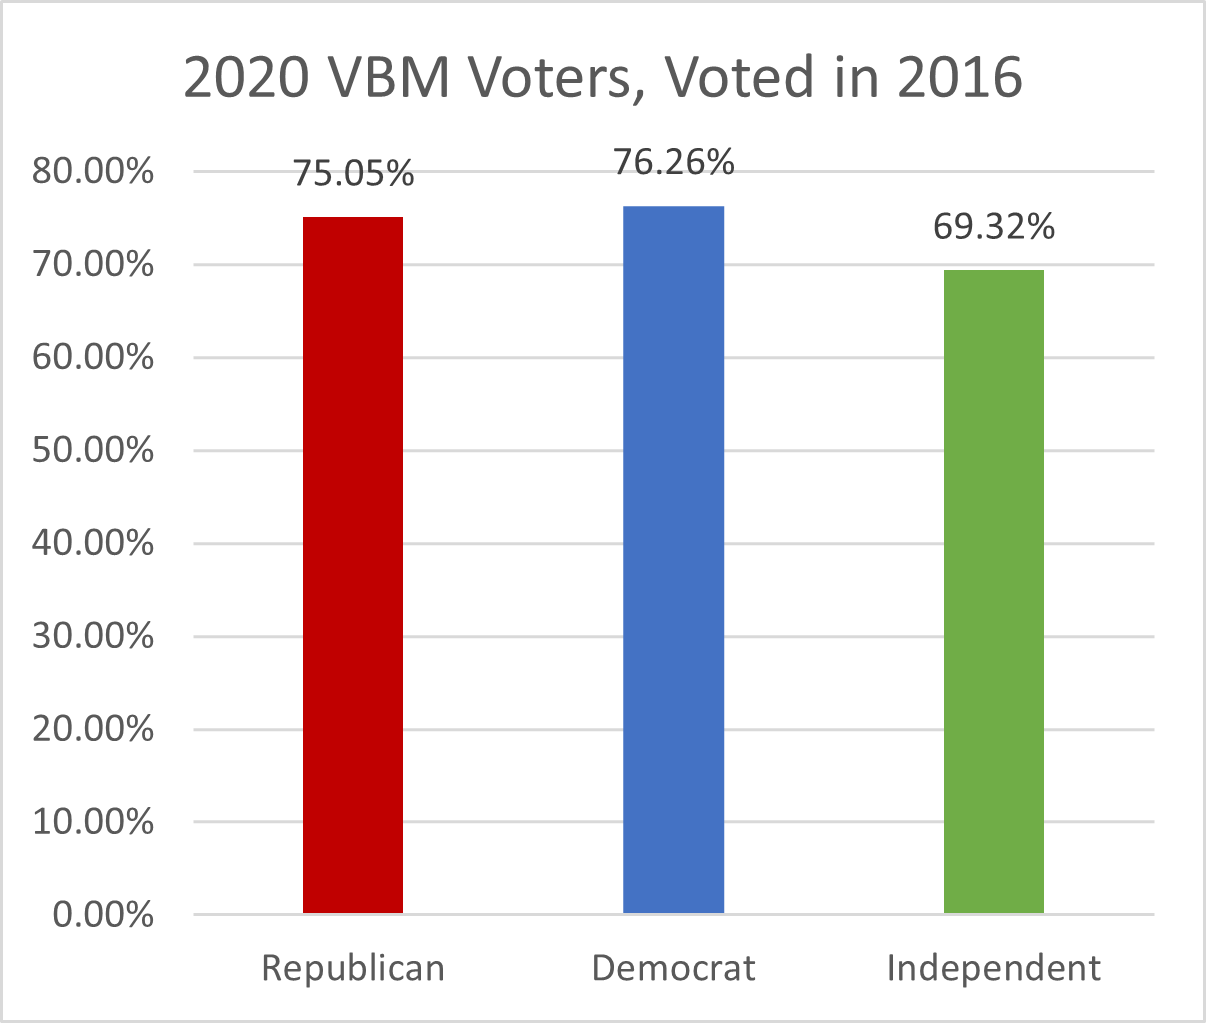
Out of the VBM pool, a slightly lower percent of Republicans voted in 2016 versus Democrats. Between that and the supervoters, this means that the VBM makeup for Republicans, for whatever reason, are made of less “consistent” Republicans. Typically this is a sign of enthusiasm.
Independents
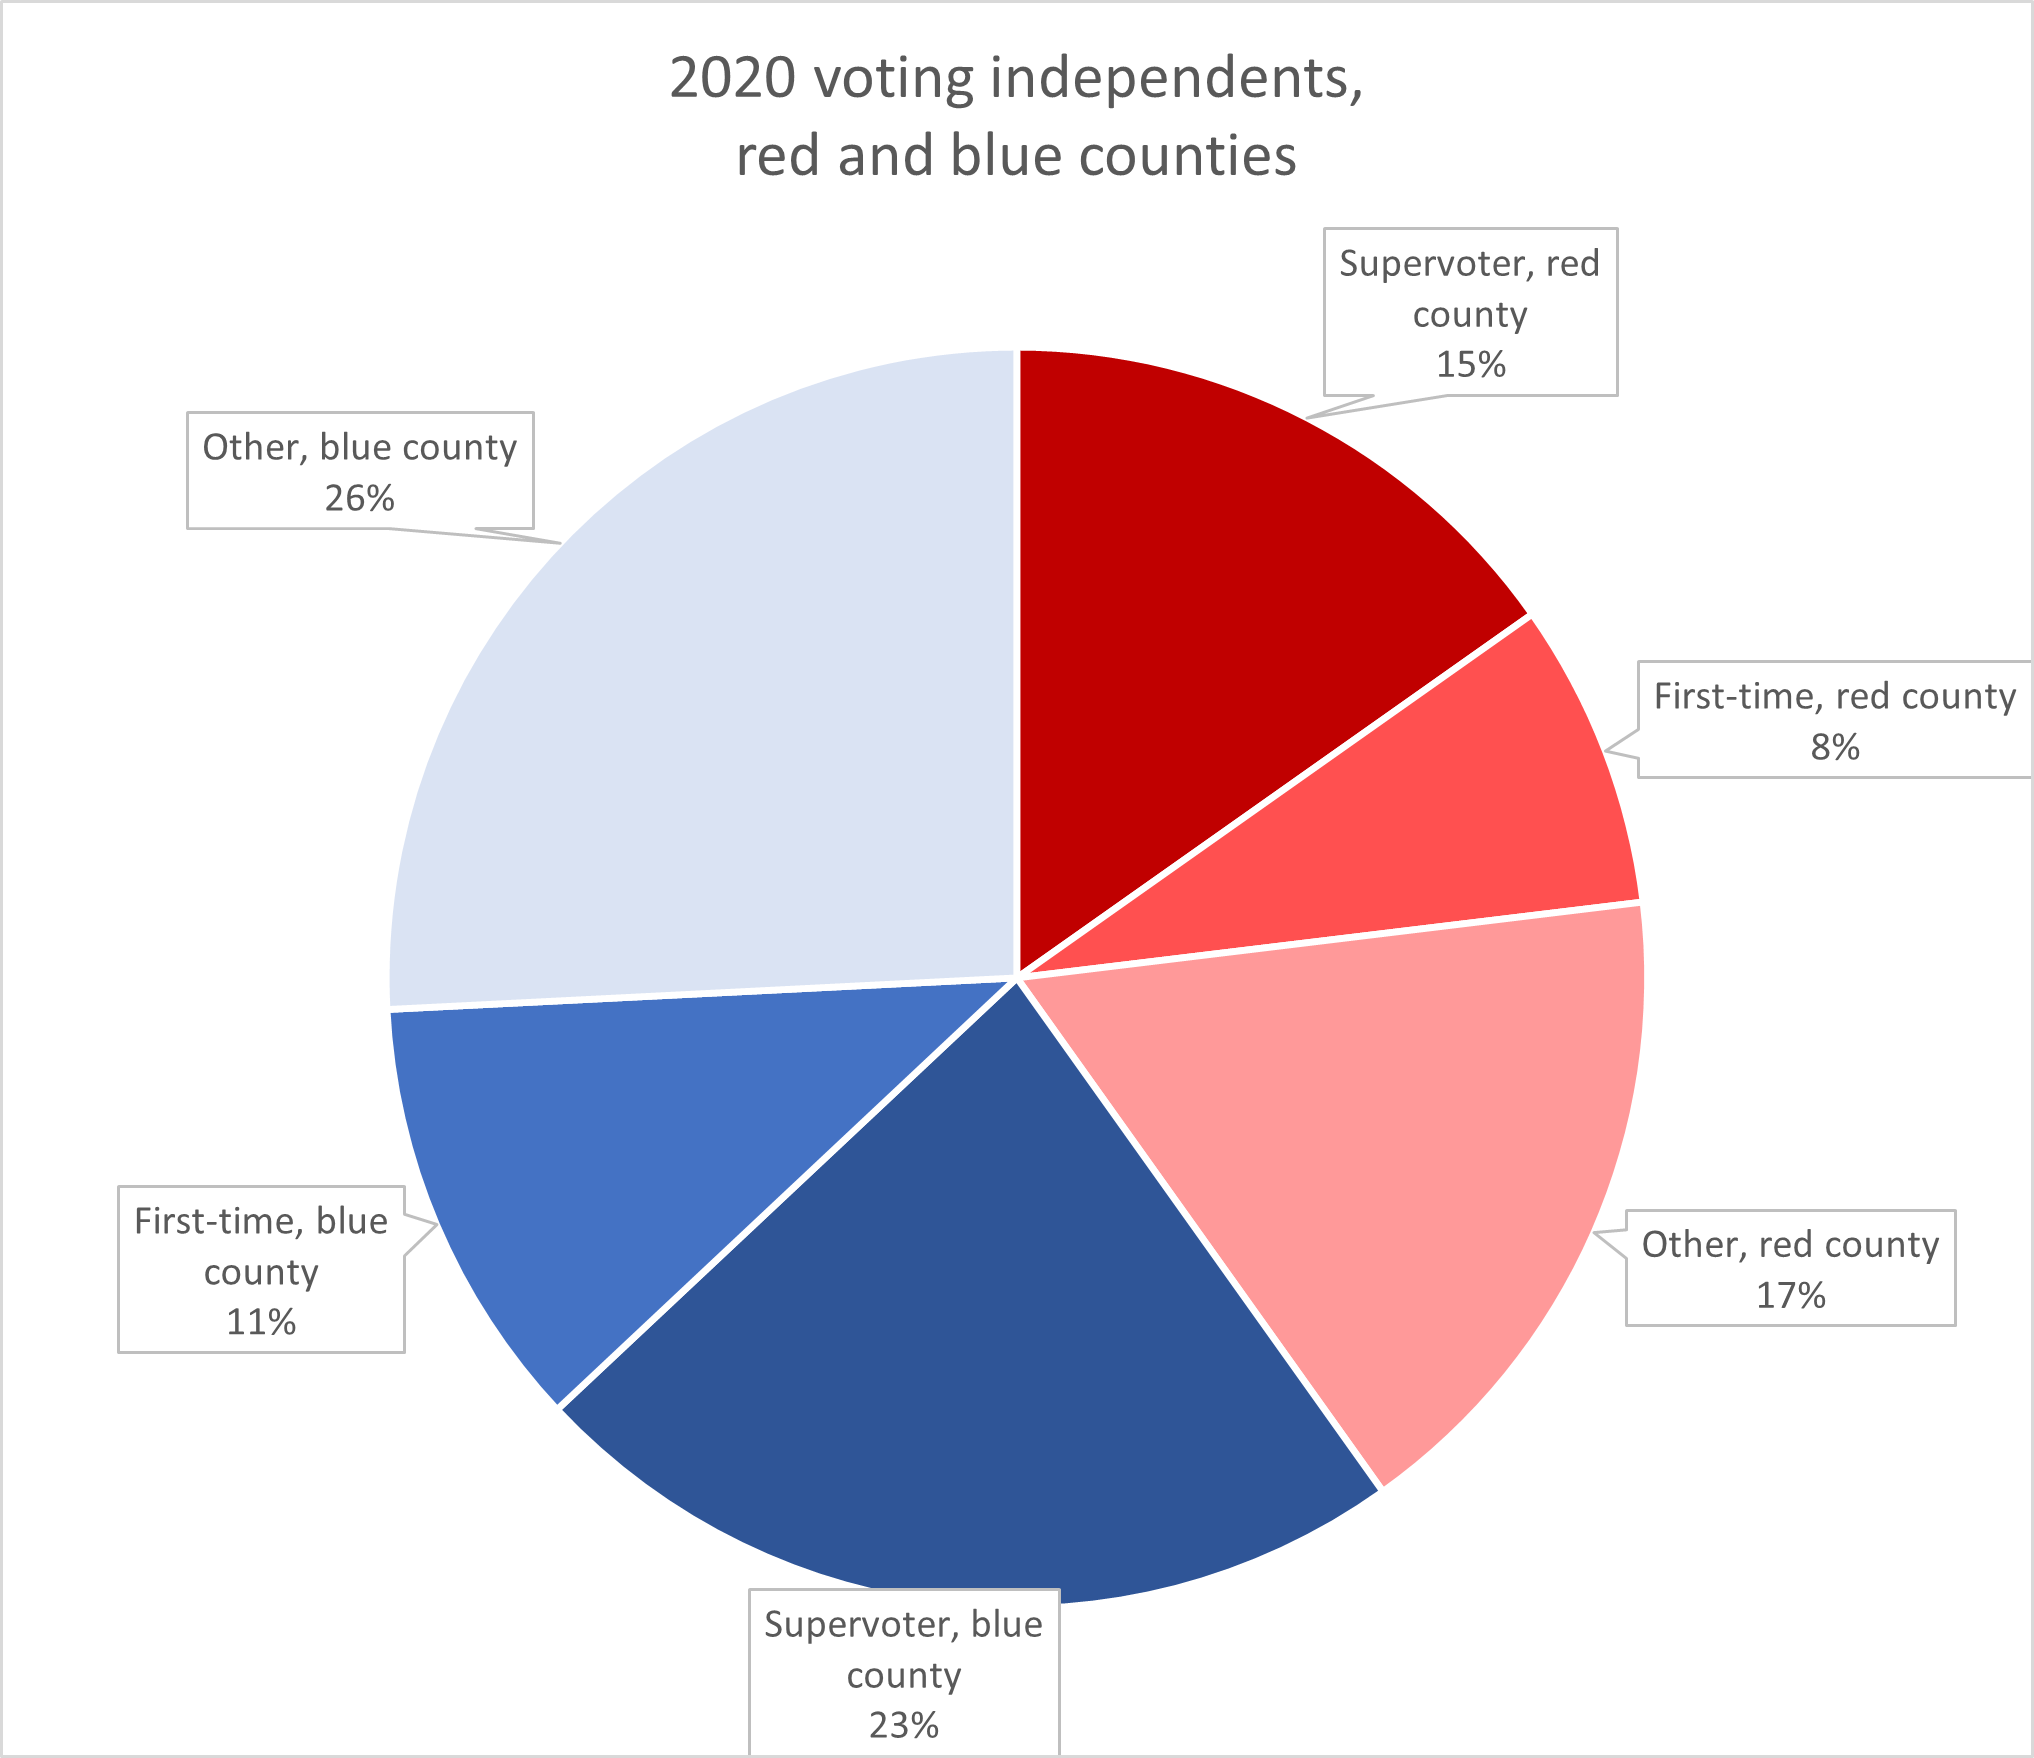
I take the independents and break them out by whether they are in red or blue counties.
Roughly 60% of independents are from blue counties versus 40% from red counties. By comparison, in 2020, the split was 50/50.
Within the counties, though, we see an interesting pattern: a larger share of independents from red counties, proportionally, are first time voters, whereas a larger share of independents from blue counties, proportionally, are supervoters. This may portend to a greater degree of enthusiasm among independents in red counties.
See more at the Independents deep dive.